Most buyers arrive at Palo Alto with one number in their head. The citywide median sits near $3.5 to $3.7 million, and homes sell for roughly 108% of list. From that, it is easy to conclude that every corner of the city behaves the same way: list, wait a week, take the highest of several overbids.
The micro-market data says otherwise. Sale-to-list ratios in Palo Alto invert with price. The lower-priced pockets push the biggest overbids. The estate tier, where the medians look most intimidating, is where sellers most often accept at or below asking. If you are underwriting an offer, that inversion matters more than the citywide headline.
The inversion, in one table
Pulled from March 2026 micro-market readings:
| Micro-market | Median sale price | Sale-to-list ratio | Months of supply |
|---|---|---|---|
| Citywide (SFH) | $3,714,400 | 108% | ~1.7 |
| Midtown | $3,265,000 | 111.67% | 0.8 |
| Crescent Park | $5.2M (4 sales) | competitive, ~9 DOM | thin |
| Professorville | $5.2M (down 12.2% YoY) | softer | thin |
| Old Palo Alto (SFH) | $11,300,000 | 97.89% | 1.2 |
Citywide figures come from SCCAOR via MLSListings for March 2026, with Houzeo confirming a 107.09% sale-to-list ratio and 1.7 months of supply for the same window. Neighborhood breakdowns are Redfin and Houzeo March 2026 readings.
Read down the rows and the story flips. A $3.26M house in Midtown is likelier to close 11-12% above list than a $9M house in Old Palo Alto is to close even 1% above it. That is the thesis. Everything below is the mechanism.
Why the estate tier so often trades at or below list
The first instinct is to blame demand. Ultra-luxury buyers exist. The $17.5M Crescent Park sale reported in January 2026 by Hoodline is proof enough that eight-figure checks are still being written. So why is Old Palo Alto's sale-to-list ratio under 98% while Midtown's is above 111%?
Two forces do the work.
Comps thin out fast at the top. Old Palo Alto shows roughly 1.2 months of supply, but the absolute count of arms-length sales in any given quarter is small. When six or seven closings define a $10M+ neighborhood's year, no comp set is tight. Sellers price to the ambitious end of the range because there is room to. Buyers, working with the same thin comps, negotiate down from that ambitious list. The result reads on paper as a sub-100% sale-to-list ratio, but the seller is often still closing near the true market value. The list price was the fiction.
Custom features cut both ways. A $12M home with a specific pool, guest house, and interior program can appraise wide of comparable square-footage sales. That widens negotiating range in a way a 1,600-square-foot Midtown ranch never sees.
The practical read for a buyer at this tier: the list price is a starting position, not an anchor. Expect a longer decision window, expect to negotiate on price and terms, and expect the sale-to-list ratio you see quoted to reflect that dynamic rather than weak demand.
Why the mid-tier overbids so hard
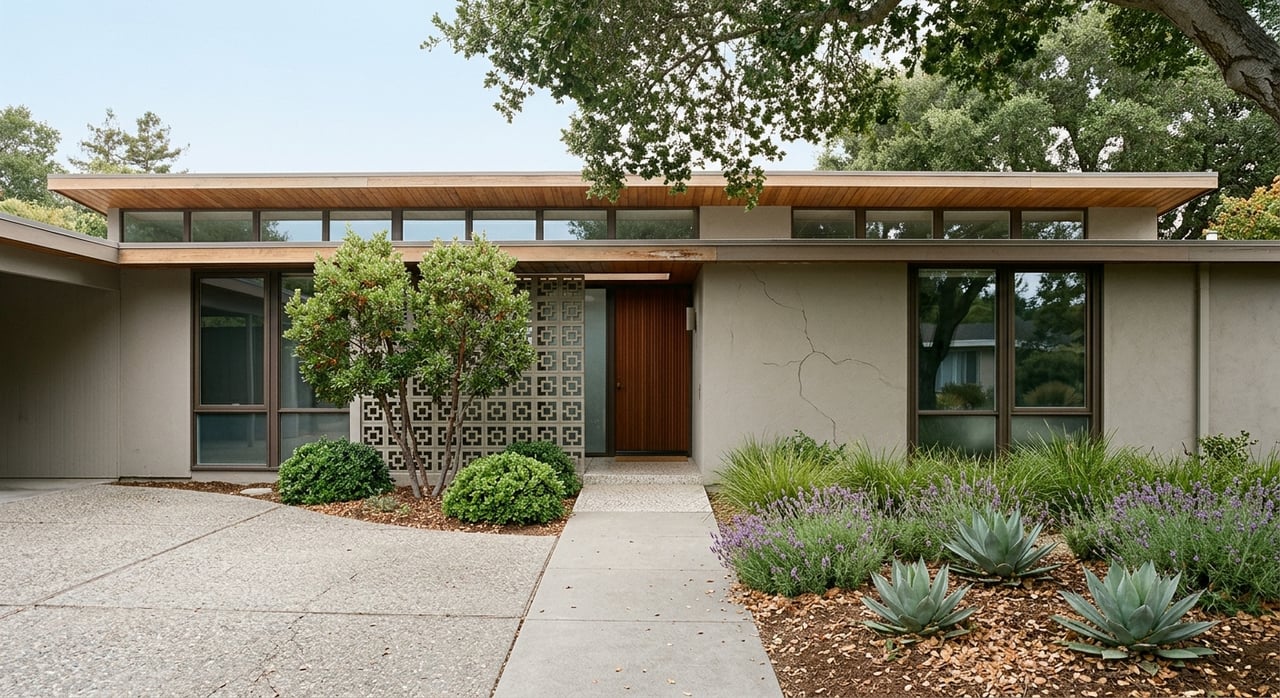
Midtown's 111.67% sale-to-list ratio on 0.8 months of supply is the mirror image. Here, comps are dense. A well-kept 1950s ranch on a 7,000-square-foot Midtown lot sits inside a comp set of dozens of similar closings a year. Both sides know what the house is worth within a fairly tight band.
Under those conditions, listing agents price at or slightly below the comp-supported range and let the offer process do the work. Every well-prepared buyer arrives with pre-approval, a written offer, and an expectation of competition. Overbidding is not exuberance. It is the mechanism the market uses to sort a queue of qualified buyers competing for a small number of near-identical homes. Houzeo's citywide reading that 67.39% of Palo Alto homes sold above asking in the recent window is driven by exactly this dynamic in the $2M to $4M band.
Condos deepen the pattern. Midtown condos run around $2.2M, Old Palo Alto condos around $1.7M, and both compete against a buyer pool that includes downsizers who have sold a larger home and are working with cash. Those buyers do not need financing contingencies, which lets them bid tighter and higher relative to list.
A warning about single-neighborhood year-over-year numbers
Crescent Park's March 2026 median was up 32% year-over-year to $5.2M on four sales. Professorville's March 2026 median was down 12.2% year-over-year, also landing near $5.2M, on five sales. Same price band, opposite direction, one month.
Both readings are accurate. Neither is a trend. When a neighborhood closes four to five homes in a month, one $8M sale or one $3.5M sale swings the median by double-digit percentages. The Palo Alto Daily Post's July 15, 2026 neighborhood roundup describes Crescent Park medians "approaching $6 million" using the same Redfin data, which shows how much the framing shifts month to month.
If you are comparing micro-markets, ignore single-month YoY numbers for any neighborhood with fewer than roughly twenty annual closings. Look instead at price per square foot over trailing four quarters and at sale-to-list ratio, which is more stable because it is a ratio of two numbers that move together.
Sources also disagree on citywide direction. Zillow's Home Value Index for Palo Alto reads $3,157,559, down 12% year-over-year. Redfin's trailing three-month reading through May 2026 reads $3.6M, up 1.3%. SCCAOR's March 2026 SFH median was $3,714,400 against a 2025 annual median of $3.88M, a softening of roughly 4.3%. Three methodologies, three answers. Treat any single index as directional, not definitive.
What the inversion means for how you write an offer
The framework changes with the price tier you are shopping.
- Under $4M in the mid-tier pockets like Midtown, Downtown North, University South, or The Willows. Assume 8% to 12% over list on a well-prepared home. Arrive with full underwriting done, a short close, and minimal contingencies. The list price is an invitation, not a ceiling. Zillow ZHVI reads Downtown North at $2.08M, University South at $2.33M, and The Willows at $2.45M, which anchors that band.
- $4M to $7M in Community Center, Duveneck-St. Francis, or Professorville. Sale-to-list ratios are more variable. Watch days on market on the specific listing. Under 10 days and you are in a Midtown-style bidding queue. Past 21 days and the home is telling you it was priced ambitiously. Palo Alto homes citywide averaged 20 DOM in March 2026, so anything longer is a signal.
- $8M and up in Old Palo Alto or Crescent Park. Treat list as the top of the seller's range, not the bottom of yours. Study the last three arms-length comps in that specific pocket rather than the neighborhood median. Build in the Individual Review timeline if you plan a two-story addition or substantial reconfiguration. Palo Alto's Individual Review process for two-story residential projects historically adds 60 to 120 days to project timelines, and that entitlement runway belongs in your underwriting before you decide what a home is worth to you.
One more piece of friction that lives at the top tier: Palo Alto's tree preservation ordinance carries the densest protected canopy in Old Palo Alto and Crescent Park. Heritage trees and street trees have separate permit requirements, and a mature specimen sitting where you would want a pool or an addition can reshape your renovation math. Standard California disclosures under Civil Code §1102 will surface known items, but the tree survey and any Individual Review implications are worth commissioning before you finalize price.
FAQ
If the citywide sale-to-list ratio is 107-108%, why would any Palo Alto home close below list? Because the citywide number is an average across tiers that behave differently. Old Palo Alto's March 2026 sale-to-list was 97.89% while Midtown's was 111.67%. Both are inside "the Palo Alto market."
Which is the more useful stat, sale-to-list or price per square foot? For offer strategy in a specific micro-market, sale-to-list. It tells you how far above or below the list price the market has been clearing. For comparing two micro-markets to each other, price per square foot, because it partially adjusts for the fact that houses in different neighborhoods are different sizes.
How do I read a neighborhood that only closes a handful of homes a quarter? Widen the window. Look at trailing four quarters of closings and price per square foot rather than any single month's median. Crescent Park and Professorville both closed under six homes in March 2026, which is why the same $5.2M median could be up 32% in one and down 12% in the other.
Does the inversion hold for condos? Broadly yes. Condos in the $1.7M to $2.5M range see the tightest bidding because they attract both first-time Peninsula buyers and downsizers with cash. The overbid dynamic in condos looks more like Midtown than like Old Palo Alto, regardless of which neighborhood the condo sits in.
If you are weighing an offer in one Palo Alto micro-market against another, or trying to decide whether a specific list price is the top or the bottom of the seller's range, the answer usually lives in the last three comparable sales on that block and not in the citywide median. That is the work I do with clients before we write. Reach out to Christopher Mogensen and let's talk through where your target price band actually sits inside the current market. Let's Connect.